In Clarington, we see a lot of projects get held up because the gradation data doesn't match what the contractor expected on site. The mix of glacial till, lacustrine silts near Lake Ontario, and occasional sandy lenses means you cannot rely on visual classification alone. A proper grain size analysis combining mechanical sieving and hydrometer sedimentation gives the full distribution curve needed for material specification. We run the coarse fraction through ASTM E11 sieves and the fines through an ASTM 152H hydrometer test, producing a continuous particle-size curve from gravel down to clay colloids. For municipal infrastructure work in Bowmanville or Courtice, this data feeds directly into Proctor compaction testing to establish moisture-density relationships for engineered fill.
A single grain size distribution curve often explains more about fill performance than a dozen density tests.
Methodology and scope
Local ground factors
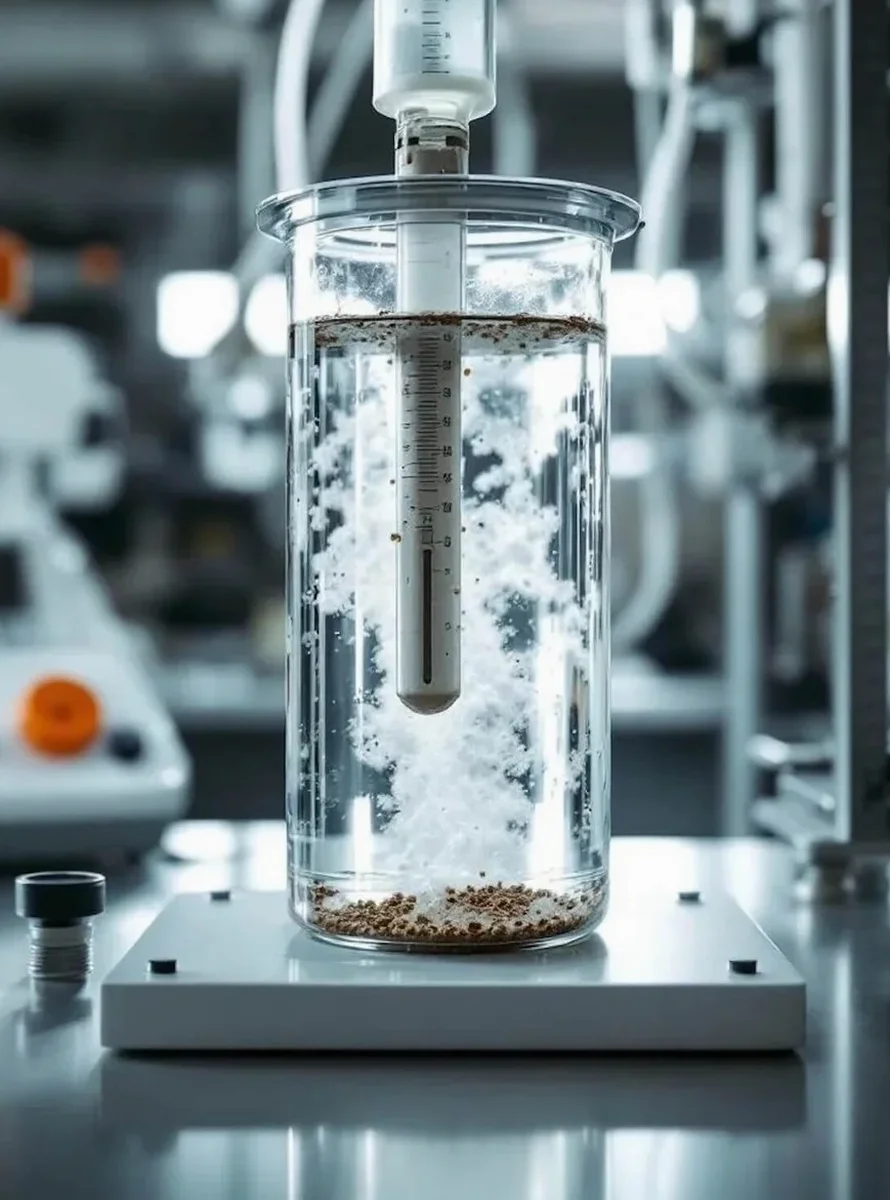
We run the hydrometer sedimentation leg of the test in a temperature-controlled bath, usually at 20 degrees Celsius, with readings taken at 0.5, 1, 2, 4, 8, 15, 30, 60, 120, and 1440 minutes. The biggest source of error in Clarington projects comes from incomplete dispersion of the fine fraction—if the silt and clay particles flocculate, the hydrometer readings overestimate sand content and you end up with a misleadingly coarse gradation curve. We use a standard mechanical stirrer and sodium hexametaphosphate dispersant at 40 g/L concentration to break down aggregates. Another common pitfall is ignoring the meniscus correction on the hydrometer stem, which can shift the calculated particle diameter by several percent. For soils with organic content—common in the low-lying areas south of Highway 401—we run a pre-treatment with hydrogen peroxide to oxidize organics before the sedimentation analysis begins.
Relevant standards
ASTM D422-63 (withdrawn but still referenced in many Clarington municipal specifications), ASTM D6913/D6913M-17: Standard Test Methods for Particle-Size Distribution (Gradation) of Soils Using Sieve Analysis, ASTM D7928-21: Standard Test Method for Particle-Size Distribution (Gradation) of Fine-Grained Soils Using the Sedimentation (Hydrometer) Analysis, AASHTO T 88-22: Particle Size Analysis of Soils, and MTO LS-702: Method of Test for Grain Size Analysis of Soils (Ontario provincial standard).
Associated technical services
Full Sieve + Hydrometer Package
Combined coarse and fine fraction analysis from 75 mm down to 0.001 mm, with calculated uniformity and curvature coefficients. Includes USCS classification per ASTM D2487 and AASHTO soil group designation. Report delivered with semi-log gradation plot and tabulated percent passing for every sieve and hydrometer reading interval.
Material Compliance Testing for Fill Operations
Targeted grain size checks on borrow sources and imported fill to verify conformance with OPSS 1010 granular material specifications. We sample from stockpiles or delivery trucks at Clarington job sites and provide same-week turnaround during peak construction season.
Typical parameters
Common questions
What sample mass is required for a complete sieve and hydrometer test in Clarington?
For soils with particles up to 19 mm (3/4 inch), we need approximately 1 kg of material. If gravel larger than 19 mm is present, the minimum sample mass increases to 2–5 kg depending on maximum particle size. The sample must be representative of the stratum in question; we can advise on field splitting procedures if you are sampling from a test pit or drill rig.
How much does a grain size analysis including hydrometer cost in the Durham Region?
How do you handle cohesive soils that are difficult to disperse for hydrometer analysis?
We use a mechanical dispersion mixer with a baffled cup and sodium hexametaphosphate solution at the concentration specified in ASTM D7928. For highly plastic clays or soils with iron oxide cementation, we may extend the soaking period or apply ultrasonic dispersion. We always run a parallel hydrometer test on a duplicate specimen if the first run shows signs of flocculation.
Can the grain size distribution curve be used to estimate permeability for drainage design?
Yes, empirical correlations like Hazen's formula (k ≈ C × D10²) provide a reasonable estimate of hydraulic conductivity for clean sands with uniformity coefficient less than 5. For silty and clayey soils, the hydrometer data feeds into more complex models such as the Kozeny-Carman equation. We include permeability estimates in the report when requested, with clear notes on the limitations of each correlation.